Dashboards can be instrumental in delivering metrics to your team, however third party tools such as BrightGauge might not fit some budgets.
ConnectWise has built four dashboards into the Manage PSA product which could be of value to many. Today we will show how to access these dashboards for instant use.
Access: To display using a separate machine, use the Read Only option for Manage. This will allow displaying the dashboards using a standalone pc; possibly connected to monitors hung on the wall. The Read Only option removes the requirement of purchasing a login just to display the dashboards.

Activate the display: These dashboards can be found by navigating to Service Desk > Service Reports > Report Name: Dashboard – Name… or navigating to System > All Reports > Service Desk > Report Name: Dashboard – Name…
![]() Add the dashboards to your Today Screen for quick access. Select the dashboard, then select Add to My reports. This function is available for any favorite reports.
Add the dashboards to your Today Screen for quick access. Select the dashboard, then select Add to My reports. This function is available for any favorite reports.
![]() Each dashboard has parameters which will need to be set prior to their use. With this capability a dashboard’s settings can be saved using the Add to My Reports function. This gives the ability to run the same dashboard simultaneously with different settings.
Each dashboard has parameters which will need to be set prior to their use. With this capability a dashboard’s settings can be saved using the Add to My Reports function. This gives the ability to run the same dashboard simultaneously with different settings.
The following Dashboards are included for instant use:
- Service – Current
- Service – In Progress
- Service – Resolution
- Service by Member
Service – Current
Use: SLA metrics, Surveys, and Ticket Volume
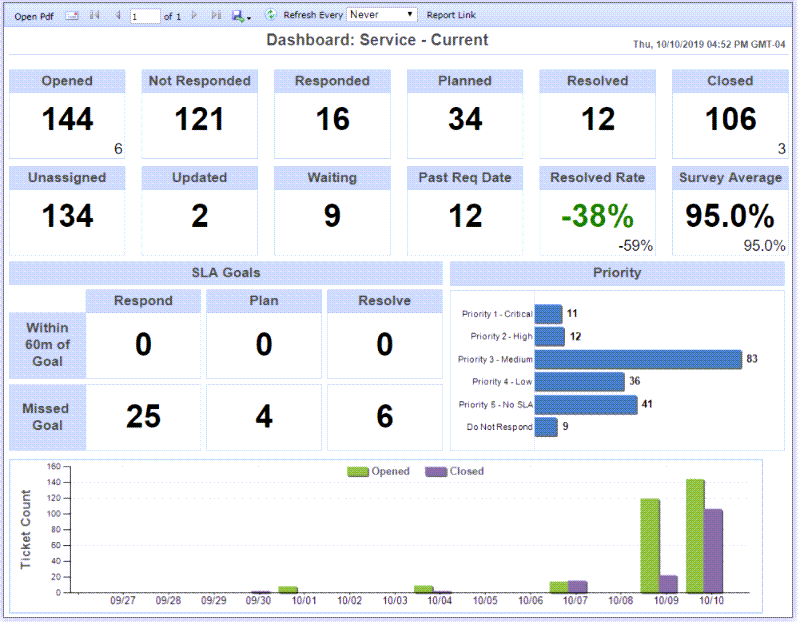
See the University KB for available parameters for this dashboard.
![]()
Service – In Progress
Use: Member ticket counts and Ticket Specs by Service Boards

See the University KB for available parameters for this dashboard.
![]()
Service – Resolution
Use: Analyze the rate of resolved to opened tickets. Current backlog, future backlog and open vs resolution trends.

See the University KB for available parameters for this dashboard.
![]()
Service by Member
Use: Service related KPI’s for team members. Survey averages, resolved tickets, and customer updated tickets. This can display service tickets, project tickets or both.

See the University KB for available parameters for this dashboard.
![]()
While these dashboards are far from BrightGauge’s reporting capabilities, they are a great way to get started in metrics. We hope these be of use for your company.